
Mar 24, 2022
A Dashboarding Tool with Bird Api
Hampir setahun yang lalu, Tom Mairs, direktur kesuksesan pelanggan Bird, menulis sebuah alat mailer yang memanfaatkan API Bird . Dalam tulisan ini, saya melanjutkan apa yang telah ia tuliskan. Alatnya memungkinkan pengiriman pekerjaan berdasarkan waktu, tetapi bagaimana jika kita ingin membuat dasbor dan catatan peristiwa kita sendiri?
Perhaps I want to create a specific dashboard for a business group or a customer-facing dashboard, but not provide users full access ke Bird UI. This script just touches the surface of what is possible utilizing Ular sawah, Plotly Dash, and API kami.
As I began my search online, I wanted to find the path of least resistance. I could have created all the dashboards and UI myself in HTML and python, however, after some Google searching, I came across Plotly's Dash, which integrates easily with python. I chose Dash for 2 reasons: 1) it is open source, and 2) after reading the documentation it seemed easily customizable for what I was trying to do. Dash adalah pustaka sumber terbuka yang ideal untuk membangun dan menerapkan aplikasi data dengan antarmuka pengguna yang disesuaikan. This made creating a UI extremely simple. The question then became, how complex did I want to make this app? The more time I spent, the more features I wanted to add.
For the initial project, I wanted to ensure that I had a dashboard with customizable metrics and a selectable timeframe. Initially, I started with a dashboard where you could only pick one metric from the dropdown. Then, as I got feedback from colleagues, I refined the dashboard a little bit to add multi-select and axis titles. I also decided to add an additional tab for an events log. I came ke point where I was satisfied with what I had as a good starting point for anyone wishing to build out their own dashboards. Of course, I put the project in Github for you to clone or branch.
Memulai
To access this app, you will need to ensure you are running python 3.10 or above and install the following libraries:
permintaan
dash
panda
Then, input your API key into App.py and run the app. It will run on http://localhost:8050. For further information on deploying this to a public-facing server (such as AWS), see the following resources:
Membuat Halaman Dasbor
Pertama, inisialisasi bingkai data dan dasbor. Tanpa menginisialisasi dasbor, tidak ada dasbor yang akan muncul di UI.
df = pd.DataFrame({
"Hitung": [0,0],
"Waktu": [0,0]
})
fig = px.line(df,x="Waktu",y="Hitung")
Then, build out the first tab. This is a combination of an app callback (to check which tab is being utilized); along with a conditional function to check which tab is currently selected. The code below builds out only the blank dashboard and UI elements (we will get to the events tab later on). The dcc elements are the Komponen Inti Dasbor and the Komponen HTML easily allow for HTML to be used in the UI.
html.H2('Dasbor Analytics'),
Menu tarik-turun #Pilih banyak pilihan
dcc.Dropdown(['Count Accepted','Count Admin Bounce','Count Block Bounce','Count Bounce','Count Clicked','Count Delayed','Count Delayed First','Count Delivered','Count Delivered First','Count Delivered Subsequent','Hitung Generasi Gagal', 'Hitung Penolakan Generasi', 'Hitung Hard Bounce', 'Hitung Inband Bounce', 'Hitung Render Awal', 'Hitung Disuntik', 'Hitung Out of Band Bounce', 'Hitung Penolakan Kebijakan', 'Hitung Ditolak','Count Rendered', 'Count Sent', 'Count Soft Bounce', 'Count Spam Complaint', 'Count Targeted', 'Count Undetermined Bounce', 'Count Unique Clicked', 'Count Unique Confirmed Opened', 'Count Unique Initial Rendered','Count Unique Rendered', 'Count Unsubscribe', 'Total Waktu Pengiriman Pertama', 'Total Waktu Pengiriman Selanjutnya', 'Total Volume Pesan'], id = "y-axis", multi = True, searchable = True, placeholder = "Select metrics(s)"),
#Pemilih tanggal (tanggal maksimum yang diizinkan diatur ke tanggal hari ini) dcc.DatePickerRange( id = 'date-picker-range', start_date = date (2022,1,1), end_date = date (2022, 2, 1), max_date_allowed = date (datetime.today().year, datetime.today().month, datetime.today().day), ),
#Objek grafik dcc.Graph( id = 'Emails', figure = fig )
Note with dash how simple creating a dashboard UI with a multi-select, searchable dropdown is. To disable multi-select or search, the parameters for creating menu tarik-turun can be easily modified. I found that the most complex part of this project was building out the actual data frame from inputs, as well as getting the HTML + CSS to work correctly in the UI.
The API Metrik Deret Waktu allows for 33 individual metrics to be pulled based on a date/time range. You can filter deeper by Domains, Campaigns, IP Pools, Sending Domains, Subaccounts, and specify the Precision of time-series data. These additional filters along with deliverability analytics could be a future improvement to this project (error catching would need to be implemented for clients who don’t have access to deliverability analytics).
Utilizing and calling the API Metrik, I build out a dashboard with the user’s selected parameters and specified timeframe. The initialized dashboard is then updated.
#Build the API call utilizing the parameters provided params = { "from" : start_date + "T00:00", "to" : end_date + "T00:00", "delimiter" : ",", "precision" : "day", "metrics" : joined_values } api_url = BASE_URL + "/metrics/deliverability/time-series" response_API = permintaan.get(api_url, headers = {"Authorization" : API_KEY}, params=params) response_info = json.loads(response_API.text) new_df = pd.json_normalize(response_info, record_path=['results']) value_array = joined_values.split(",") #Build out a new dashboard utilizing the new metrics and dates from the updated API call fig = px.line(new_df, x=new_df['ts'], y=value_array, labels={"value": "Count", "variable": "Metric","ts":"Date"}) fig.update_xaxes(title_text="Time") fig.update_yaxes(title_text="Count") return fig
Berikut ini adalah contoh beberapa metrik yang dipilih dan jangka waktu yang diperluas.
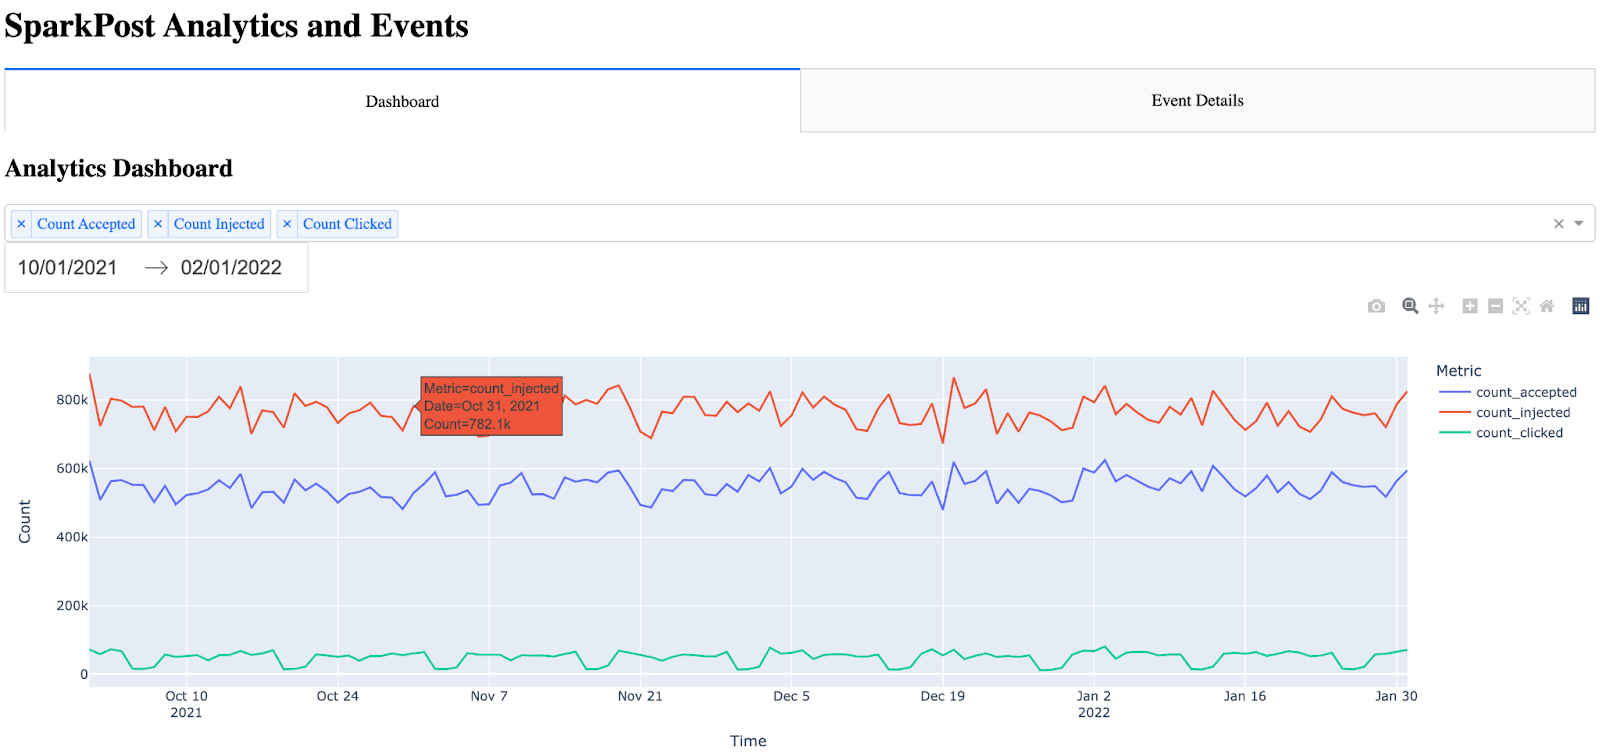
Catatan: ada banyak item yang dibangun ke dalam grafik dasbor secara otomatis (arahkan, zoom, skala otomatis).
Membuat Halaman Detail Acara
Halaman detail acara sedikit lebih sulit karena saya tidak tahu cara terbaik untuk menampilkan semua metrik acara dengan cara yang mudah dibaca. Saya mempertimbangkan untuk menambahkan parameter pemfilteran ke halaman ini, namun, saya memutuskan bahwa hal itu akan menambah banyak waktu pada proyek ini karena tabelnya akan menjadi dinamis (bersama dengan menambahkan parameter, callback, dll.). Saya memutuskan untuk menampilkan semua kejadian dan menempatkan stempel waktu terlebih dahulu (karena tanpa menempatkan stempel waktu terlebih dahulu, bagan tidak mudah dibaca). Awalnya, saya menemukan bahwa hanya dengan HTML mentah, tabel tersebut sangat sulit untuk dilihat. Tidak ada batas dan tidak ada perbedaan warna untuk header vs baris. Untuk membuat tabel lebih mudah dibaca, saya dapat menggunakan CSS di dalam Dash.
The idea for the event details is almost the same as the dashboard, except this time, I call the API Peristiwa and bring in all events. Note the event details only shows the 10 most recent events (utilizing the max_rows parameter and API filtering). This can be increased, however, I settled on showing the 10 most recent events because the more events have shown, the longer the API call takes. One significant improvement that could be made would be the ability to paginate and include a Next Page / Previous Page in the UI.
Untuk membuat tab (halaman) peristiwa, pertama, saya memanggil API Peristiwa dan mengurai respons JSON menjadi bingkai data. Kemudian saya mengurutkan dan menyusun ulang bingkai data untuk menempatkan cap waktu sebagai kolom pertama. Terakhir, saya membuat tabel HTML dengan mengulang-ulang bingkai data.
#Build out and call the events API params = { "events" : "delivery,injection,bounce,delay,policy_rejection,out_of_band,open,click,generation_failure,generation_rejection,spam_complaint,list_unsubscribe,link_unsubscribe", "delimiter" : ",", "page" : "1", "per_page" : "10" } api_url = BASE_URL + "/events/message" response_API = requests.get(api_url, headers = {"Authorization" : API_KEY}, params=params) response_info = json.loads(response_API.text) new_df = pd.json_normalize(response_info, record_path=['results']) max_rows=10 #Max number of results show in the events table #Place timestamp as the first column in the table new_df = new_df.reindex(sorted(new_df.columns), axis=1) cols = ['timestamp'] new_df = new_df[cols + [c for c in new_df.columns if c not in cols]] #Show the new HTML with the events table (note, this table also references table.css) return html.Div([ html.H2("Event Details"), html.Table([ html.Thead( html.Tr([html.Th(col) for col in new_df.columns],className="table_css") ), html.Tbody([ html.Tr([ html.Td(new_df.iloc[i][col],className="table_css") for col in new_df.columns ]) for i in range(min(len(new_df), max_rows)) ]) ]) ])
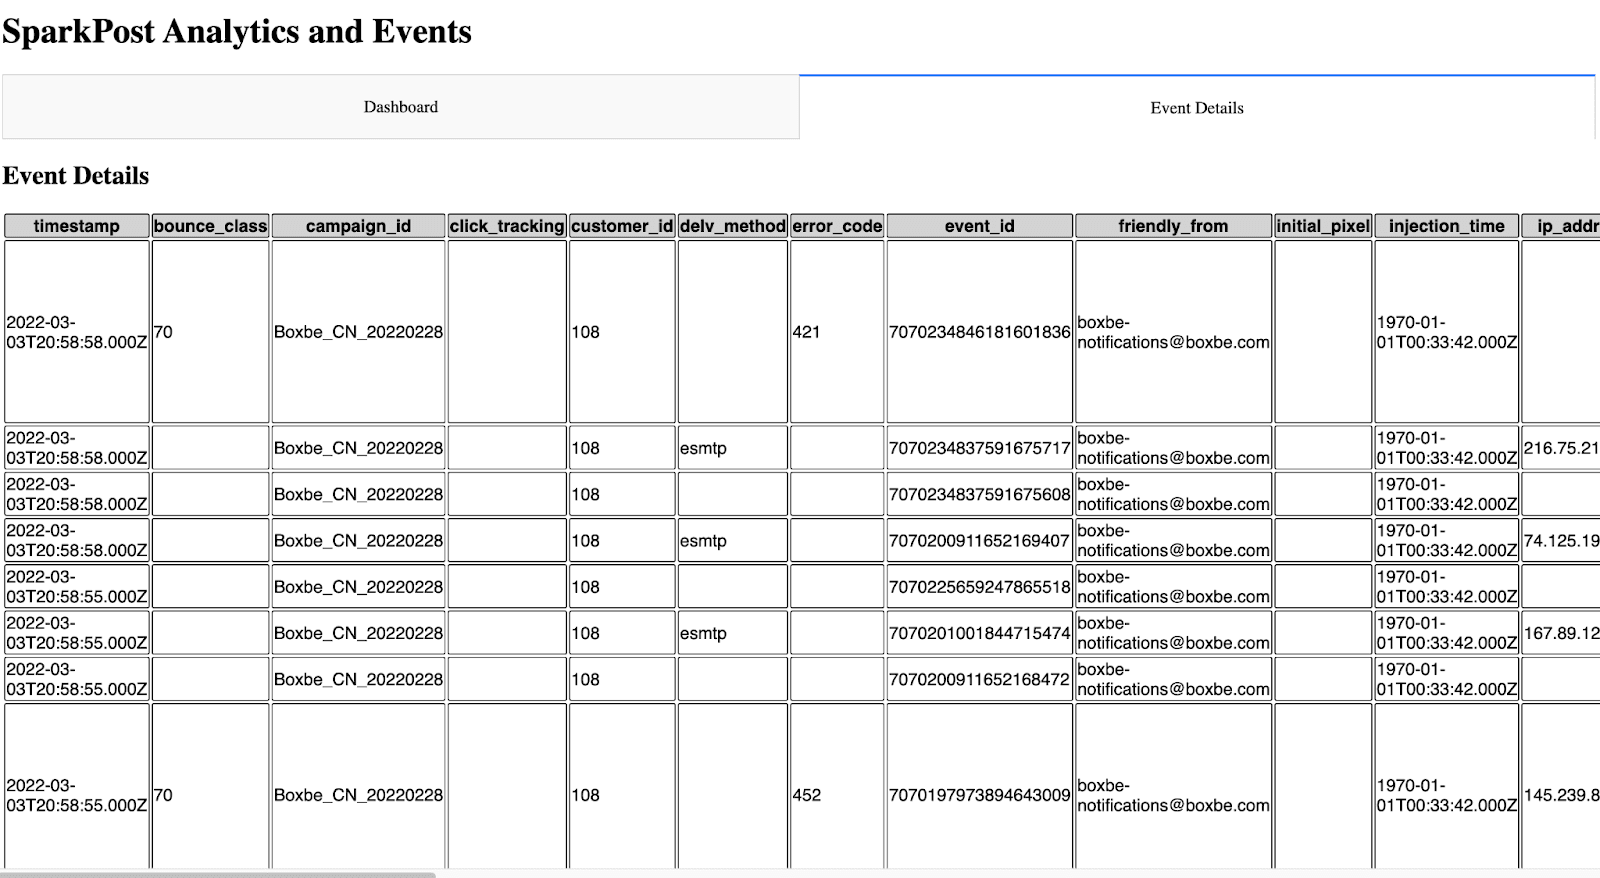
Yang terlihat seperti ini di UI.
Langkah Selanjutnya
Bagi seseorang yang ingin membuat dasbor atau catatan peristiwa mereka sendiri, ini merupakan awal yang baik. Dengan kemampuan kustomisasi di sini, langit adalah batasnya.
Seperti yang telah dibahas di atas, beberapa perbaikan di masa depan yang dapat dilakukan adalah:
Menambahkan analisis keterkiriman ke dasbor
Menambahkan lebih banyak filter ke dasbor
Opsi cache yang memungkinkan sehingga API tidak dipanggil setiap saat untuk menampilkan halaman
Peningkatan UI
Menambahkan pemfilteran dan pagination ke halaman detail acara
I’d be interested in mendengar umpan balik apa pun or suggestions for expanding this project.
~ Zach Samuels, Bird Senior Solusi Engineer