
Mar 24, 2022
A Dashboarding Tool with Bird API's
Bijna een jaar geleden schreef Tom Mairs, Bird's director of customer success, een mailer tool die gebruik maakt van Bird API's. In deze post ga ik verder waar hij gebleven was. Met zijn tool kunnen taken op tijd worden verzonden, maar wat als we onze eigen dashboards en event logs willen maken?
Perhaps I want to create a specific dashboard for a business group or a customer-facing dashboard, but not provide users full access naar de Bird UI. This script just touches the surface of what is possible utilizing Python, Plotly Dash, and onze API's.
As I began my search online, I wanted to find the path of least resistance. I could have created all the dashboards and UI myself in HTML and python, however, after some Google searching, I came across Plotly's Streepje, which integrates easily with python. I chose Dash for 2 reasons: 1) it is open source, and 2) after reading the documentation it seemed easily customizable for what I was trying to do. Dash is een open-source bibliotheek die ideaal is voor het bouwen en implementeren van data-apps met aangepaste gebruikersinterfaces. This made creating a UI extremely simple. De question then became, how complex did I want to make this app? De more time I spent, the more features I wanted to add.
For the initial project, I wanted to ensure that I had a dashboard with customizable metrics and a selectable timeframe. Initially, I started with a dashboard where you could only pick one metric from the dropdown. Then, as I got feedback from colleagues, I refined the dashboard a little bit to add multi-select and axis titles. I also decided to add an additional tab for an events log. I came naar de point where I was satisfied with what I had as a good starting point for anyone wishing to build out their own dashboards. Of course, I put the project in Github for you to clone or branch.
Aan de slag
To access this app, you will need to ensure you are running python 3.10 or above and install the following libraries:
verzoekt
dash
panda's
Then, input your API key into App.py and run the app. It will run on http://localhost:8050. For further information on deploying this to a public-facing server (such as AWS), see the following resources:
De dashboardpagina maken
Initialiseer eerst het gegevensframe en het dashboard. Zonder het dashboard te initialiseren, verschijnt er geen dashboard in de UI.
df = pd.DataFrame({
"Count": [0,0],
"Tijd": [0,0]
})
fig = px.line(df,x="Time",y="Count")
Then, build out the first tab. This is a combination of an app callback (to check which tab is being utilized); along with a conditional function to check which tab is currently selected. The code below builds out only the blank dashboard and UI elements (we will get to the events tab later on). The dcc elements are the Dash Kerncomponenten and the HTML-onderdelen easily allow for HTML to be used in the UI.
html.H2('Analytics Dashboard'),
#Dropdown met meerdere keuzes
dcc.Dropdown(['Count Accepted','Count Admin Bounce','Count Block Bounce','Count Bounce','Count Clicked','Count Delayed','Count Delayed First','Count Delivered','Count Delivered First','Count Delivered Subsequent',Count Generation Failed', 'Count Generation Rejection','Count Hard Bounce','Count Inband Bounce','Count Initial Rendered','Count Injected','Count Out of Band Bounce','Count Policy Rejection','Count Rejected',Aantal Afgewezen","Aantal Verzonden","Aantal Zachte Bounce","Aantal Spamklachten","Aantal Gericht","Aantal Onbepaalde Bounce","Aantal Uniek Geklikt","Aantal Uniek Bevestigd Geopend","Aantal Uniek Oorspronkelijke Afgewezen",Count Uniek Gerenderd','Count Uitschrijven','Totale Levertijd Eerste','Totale Levertijd Volgende','Totaal Berichtvolume'], id="y-as", multi=True, doorzoekbaar=True, placeholder="Selecteer metriek(en)"),
#Date selector (max datum toegestaan is ingesteld op de datum van vandaag) dcc.DatePickerRange( id='date-picker-range', start_date=datum(2022,1,1), end_date=datum(2022, 2, 1), max_date_allowed=datum(datetime.today().year,datetime.today().month,datetime.today().day), ),
#Grafiek object dcc.Graph( id='E-mails', figuur=fig )
Note with dash how simple creating a dashboard UI with a multi-select, searchable dropdown is. To disable multi-select or search, the parameters for creating een vervolgkeuzelijst can be easily modified. I found that the most complex part of this project was building out the actual data frame from inputs, as well as getting the HTML + CSS to work correctly in the UI.
The Tijdreeks metriek API allows for 33 individual metrics to be pulled based on a date/time range. You can filter deeper by Domains, Campaigns, IP Pools, Sending Domains, Subaccounts, and specify the Precision of time-series data. These additional filters along with deliverability analytics could be a future improvement to this project (error catching would need to be implemented for clients who don’t have access to deliverability analytics).
Utilizing and calling the Metriek API, I build out a dashboard with the user’s selected parameters and specified timeframe. The initialized dashboard is then updated.
#Build the API call utilizing the parameters provided params = { "from" : start_date + "T00:00", "to" : end_date + "T00:00", "delimiter" : ",", "precision" : "day", "metrics" : joined_values } api_url = BASE_URL + "/metrics/deliverability/time-series" response_API = verzoekt.get(api_url, headers = {"Authorization" : API_KEY}, params=params) response_info = json.loads(response_API.text) new_df = pd.json_normalize(response_info, record_path=['results']) value_array = joined_values.split(",") #Build out a new dashboard utilizing the new metrics and dates from the updated API call fig = px.line(new_df, x=new_df['ts'], y=value_array, labels={"value": "Count", "variable": "Metric","ts":"Date"}) fig.update_xaxes(title_text="Time") fig.update_yaxes(title_text="Count") return fig
Het volgende is een voorbeeld van meerdere geselecteerde statistieken en een uitgebreid tijdsbestek.
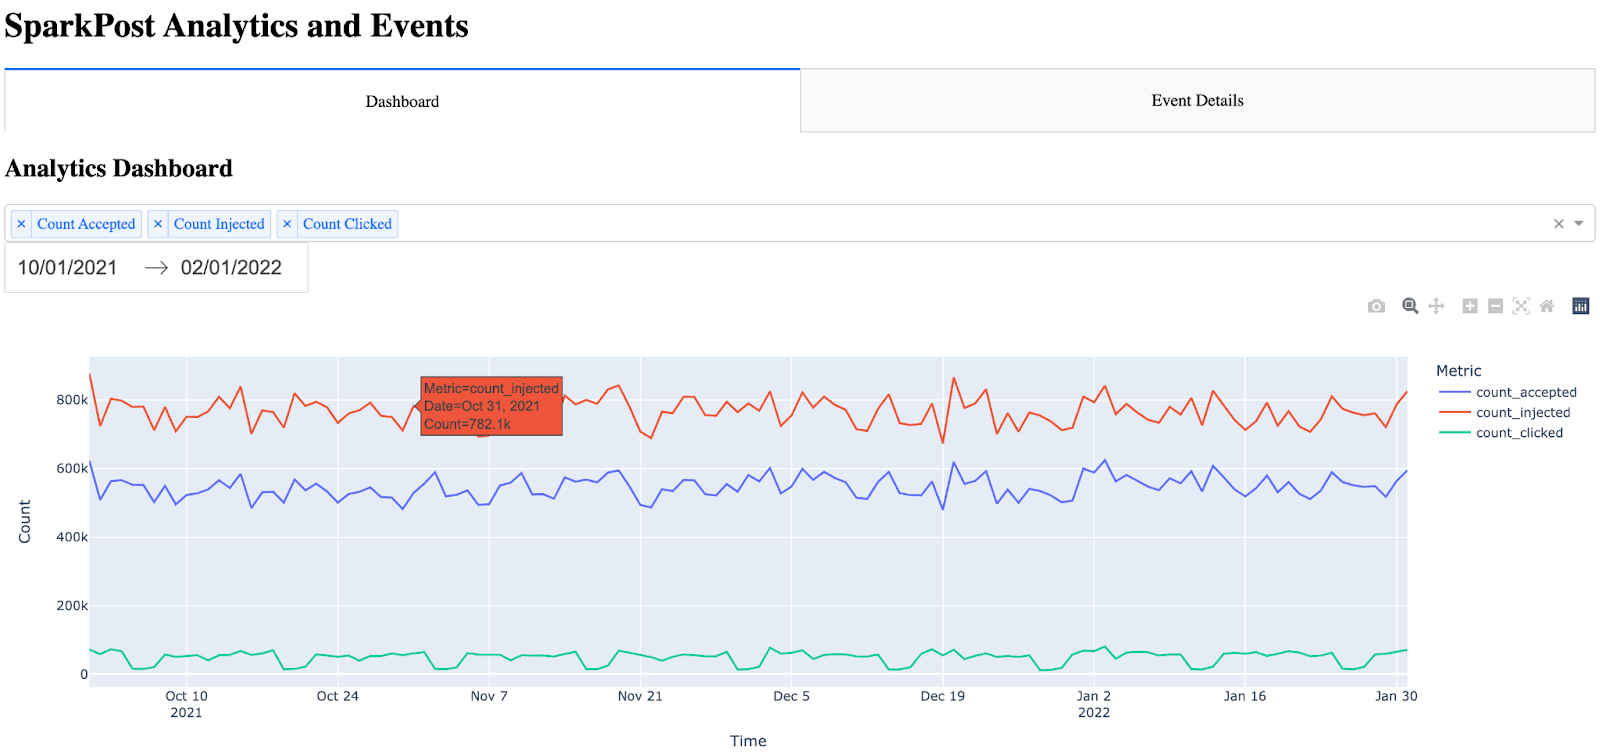
Opmerking: er zijn veel items automatisch ingebouwd in de streepjesgrafiek (zweven, zoomen, automatisch schalen).
De pagina Evenementgegevens maken
De event details pagina was iets moeilijker omdat ik niet wist wat de beste manier was om alle events op een overzichtelijke manier te presenteren. Ik heb overwogen om filterparameters aan deze pagina toe te voegen, maar ik besloot dat dit veel tijd aan dit project zou toevoegen omdat de tabel dan dynamisch zou moeten zijn (samen met het toevoegen van de parameters, callbacks, etc.). Ik besloot alle gebeurtenissen weer te geven en de tijdstempel als eerste te plaatsen (omdat de grafiek zonder de tijdstempel niet gemakkelijk te lezen was). Aanvankelijk vond ik dat de tabel met alleen de ruwe HTML ongelooflijk moeilijk was voor de ogen. Er waren geen randen en geen kleurverschillen tussen kop en rijen. Om de tabel beter leesbaar te maken, kon ik CSS gebruiken binnen Dash.
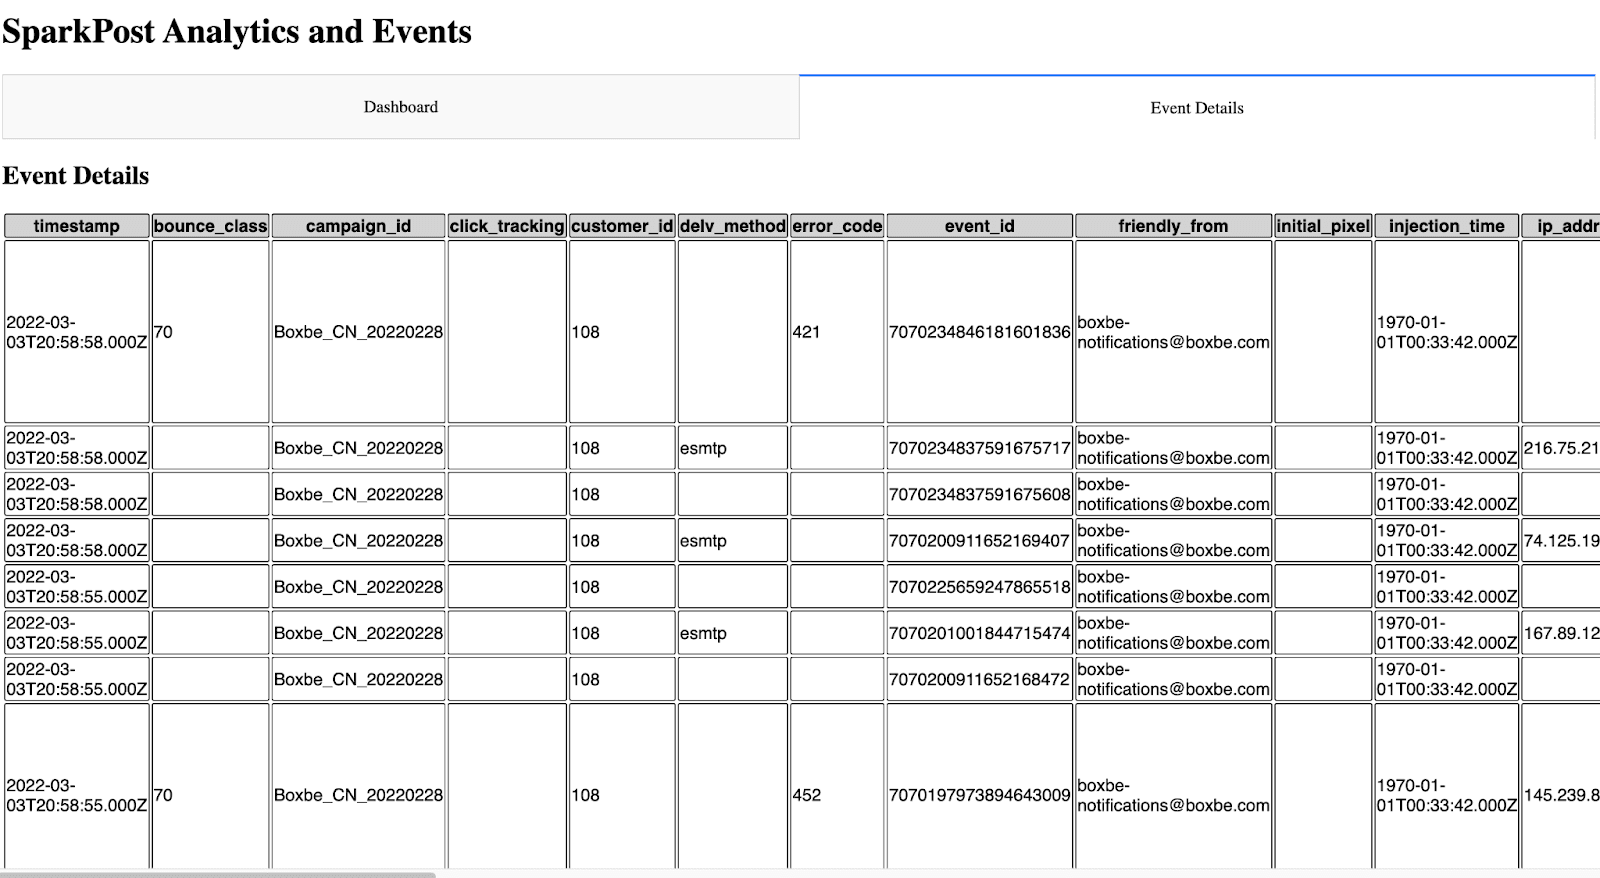
The idea for the event details is almost the same as the dashboard, except this time, I call the Gebeurtenissen API and bring in all events. Note the event details only shows the 10 most recent events (utilizing the max_rows parameter and API filtering). This can be increased, however, I settled on showing the 10 most recent events because the more events have shown, the longer the API call takes. One significant improvement that could be made would be the ability to paginate and include a Next Page / Previous Page in the UI.
Om het tabblad Gebeurtenissen (pagina) op te bouwen, roep ik eerst de Gebeurtenissen-API aan en parseer ik het JSON-antwoord in een gegevensframe. Vervolgens sorteer en herschik ik het dataframe zodat de tijdstempel de eerste kolom is. Ten slotte bouw ik de HTML-tabel op door iteratie van het dataframe.
#Build out and call the events API params = { "events" : "delivery,injection,bounce,delay,policy_rejection,out_of_band,open,click,generation_failure,generation_rejection,spam_complaint,list_unsubscribe,link_unsubscribe", "delimiter" : ",", "page" : "1", "per_page" : "10" } api_url = BASE_URL + "/events/message" response_API = requests.get(api_url, headers = {"Authorization" : API_KEY}, params=params) response_info = json.loads(response_API.text) new_df = pd.json_normalize(response_info, record_path=['results']) max_rows=10 #Max number of results show in the events table #Place timestamp as the first column in the table new_df = new_df.reindex(sorted(new_df.columns), axis=1) cols = ['timestamp'] new_df = new_df[cols + [c for c in new_df.columns if c not in cols]] #Show the new HTML with the events table (note, this table also references table.css) return html.Div([ html.H2("Event Details"), html.Table([ html.Thead( html.Tr([html.Th(col) for col in new_df.columns],className="table_css") ), html.Tbody([ html.Tr([ html.Td(new_df.iloc[i][col],className="table_css") for col in new_df.columns ]) for i in range(min(len(new_df), max_rows)) ]) ]) ])
Dat ziet er zo uit in de UI.
Volgende stappen
Voor iemand die zijn eigen dashboard of gebeurtenissenlogboek wil maken, is dit een goed begin. Met de aanpasbaarheid hier is de sky the limit.
Zoals hierboven besproken, zijn enkele toekomstige verbeteringen mogelijk:
Deliverability-analyses toevoegen aan het dashboard
Meer filters toevoegen aan het dashboard
Mogelijke caching-opties zodat de API niet elke keer wordt aangeroepen om de pagina's weer te geven
UI-verbeteringen
Filteren en pagineren toevoegen aan de pagina met evenementdetails
I’d be interested in feedback horen or suggestions for expanding this project.
~ Zach Samuels, Bird Senior Oplossingen Engineer